

Project Overview- A speculative brand refresh and communications system for a Chicago nonprofit dog rescue — developed pro bono to demonstrate data visualization, infographic design, and Instagram carousel strategy. The existing branding undersold the organization's impact, so a complete identity system was developed from scratch including style guide, annual report infographic, and omnichannel social content.
Role- Brand & Communications Designer — sole contributor across brand identity, style guide, infographic design, content creation, and social media strategy.
Pal’s Place, a nonprofit dog rescue, needed an annual report to detail its accomplishments to potential donors. A one page infographic was developed to begin the process.
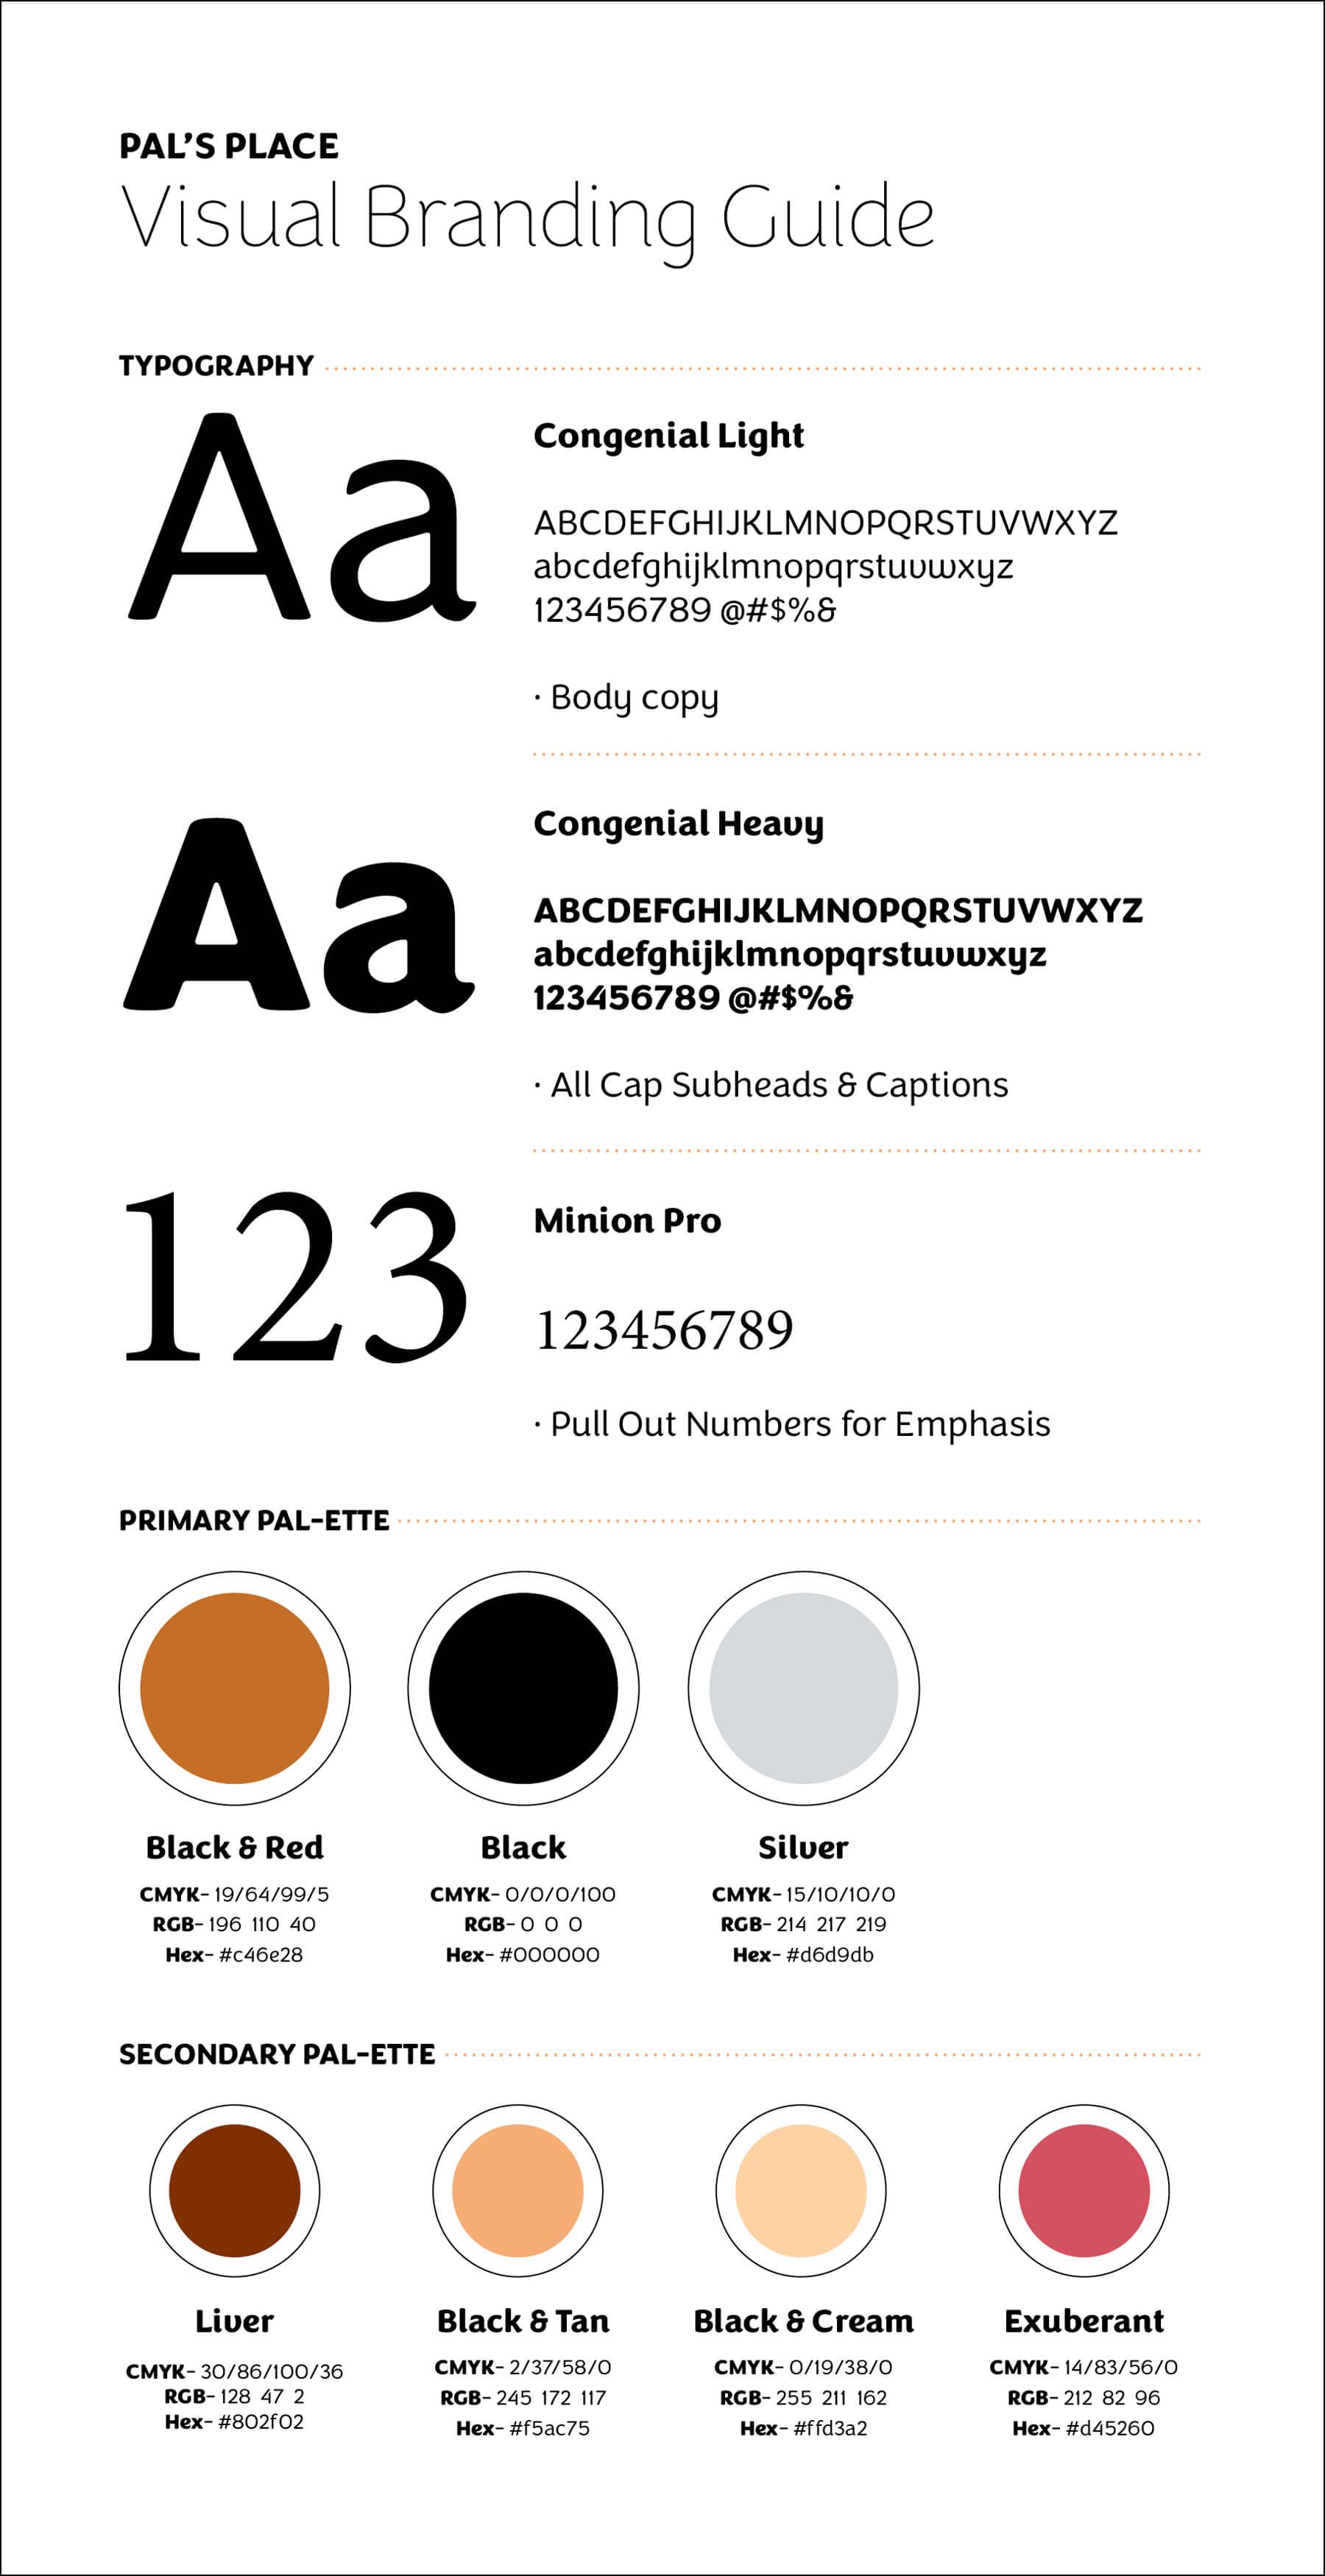
Branding was anchored with the Congenial type face, chosen for its approachable tone, balanced by a traditional serif to establish data reliability.
The color palette, inspired by the varied coats of rescue dogs, pays tribute to the German Shepherd breed, honoring Pal, the first rescue and namesake.


An omnichannel marketing approach adapted the infographics into a carousel format for Instagram, alongside standalone posts distributed throughout the year.
Each post incorporates hashtags and links to drive engagement, promoting adoption, fostering, and contributions to the rescue.